REColorado Real Estate Market Watch – November 2020
Monthly Housing Market Statistics: November 2020
Homes Closed
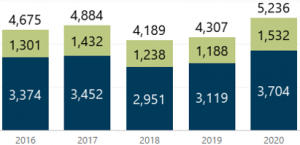
In November, more homes sold than any other November on record. Throughout the month, 5,236 homes closed, a year-over-year increase of 22% and a 19% decrease month over month.
The count of listings in Pending status was 4,811, which is 16% more than November 2019 and 18% less than last month, indicating the market has remained strong through the fall months.
Homes Closed Year-Over-Year Change
November 2019 — 4,307 November 2020 — 5,236 +22%
Prices
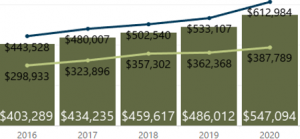
The Average Closed Price of a home in the Denver metro area in November was $547,094, a year-over-year increase of 13% and 2% less than last month.
The Average Closed Price for Single-Family homes was $612,984, a 15% year-over-year increase and a 2% month-over-month decrease. Multi-Family/ Condo/Townhomes closed for an average price of $387,789, a 7% year-over-year increase and a 1% month-over-month decrease.
Average Closed Prices Year-Over-Year Change
November 2019 — $486,012 November 2020 — $547,094 +13%
New Listings
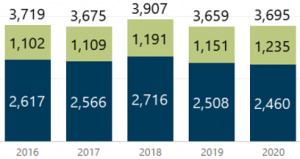
Throughout November, 3,695 New Listings of homes for sale hit the market, which is 1% higher than November of 2019. Compared to last month, the count of New Listings saw a seasonal decrease of 40%.
At the end of November, there were only 3,597 Active properties on the market, 47% fewer than last year at this time and 19% fewer than last month.
Currently, there are 3 weeks of inventory, 4 weeks fewer than this time last year and unchanged from last month.
New Listings Year-Over-Year Change
November 2019 — 3,659 November 2020 — 3,695 +1%
Days in MLS
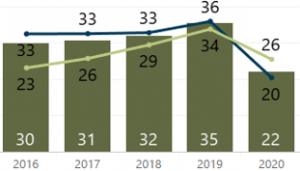
Denver metro homes spent an average of 22 Days in the MLS in November, 13 days fewer than this time last year and 2 days fewer than last month. On average, Single-Family Residences were on the market 20 days, while Multi-Family/Condo/Townhome properties were on the market 26 days.
The median number of days a home spent in the MLS in November was 6, down 14 days from last year.
Days in MLS Year-Over-Year Change
November 2019 — 35 November 2020 — 22 -13 days
Year to Date
At the end of November, most of the year-to-date indicators continue to show positive year-over-year gains. The number of Closed Listings year to date is 7% higher than this time last year and the highest count we have on record. While New Listings remain tight, the year-to-date gap remains at 2% fewer than this time in 2019. The average Closed Price is up 8% from last year due in part to high buyer demand, limited inventory, and low interest rates. Homes spent an average of 26 days in the MLS, 5 days fewer than the previous year.

Download a PDF version of the November 2020 Detailed Market Watch Report >>